MQ135 Gas Sensor for CO₂ and Ethanol Concentration Measurement
A calibrated low-cost gas sensor used to compare air quality across 15 locations on campus, from open rooftops to a crowded lab.
Built, calibrated after a 24-hour preheat, and used for real measurements.
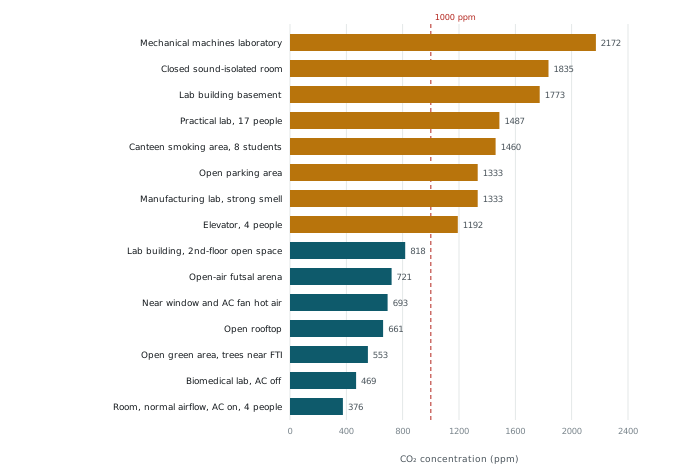
15 locations, about 376 to 2,172 ppm, higher in enclosed and crowded spaces.
Not checked against a reference CO₂ meter. Ethanol readings went beyond the sensor model's valid range, so only the response pattern is reported.
System and calibration
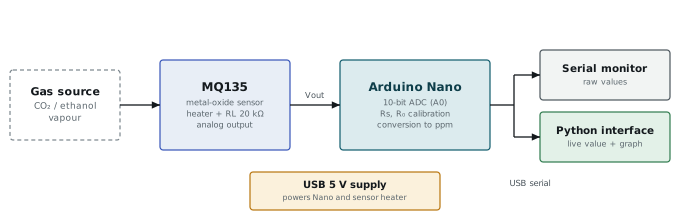
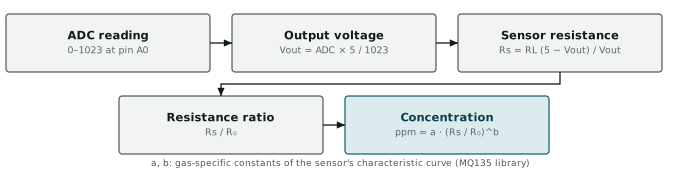
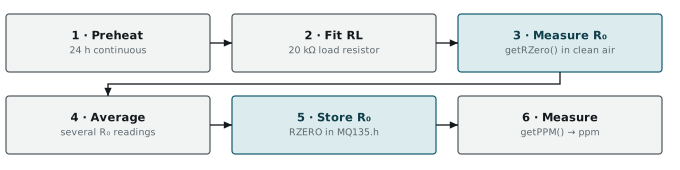
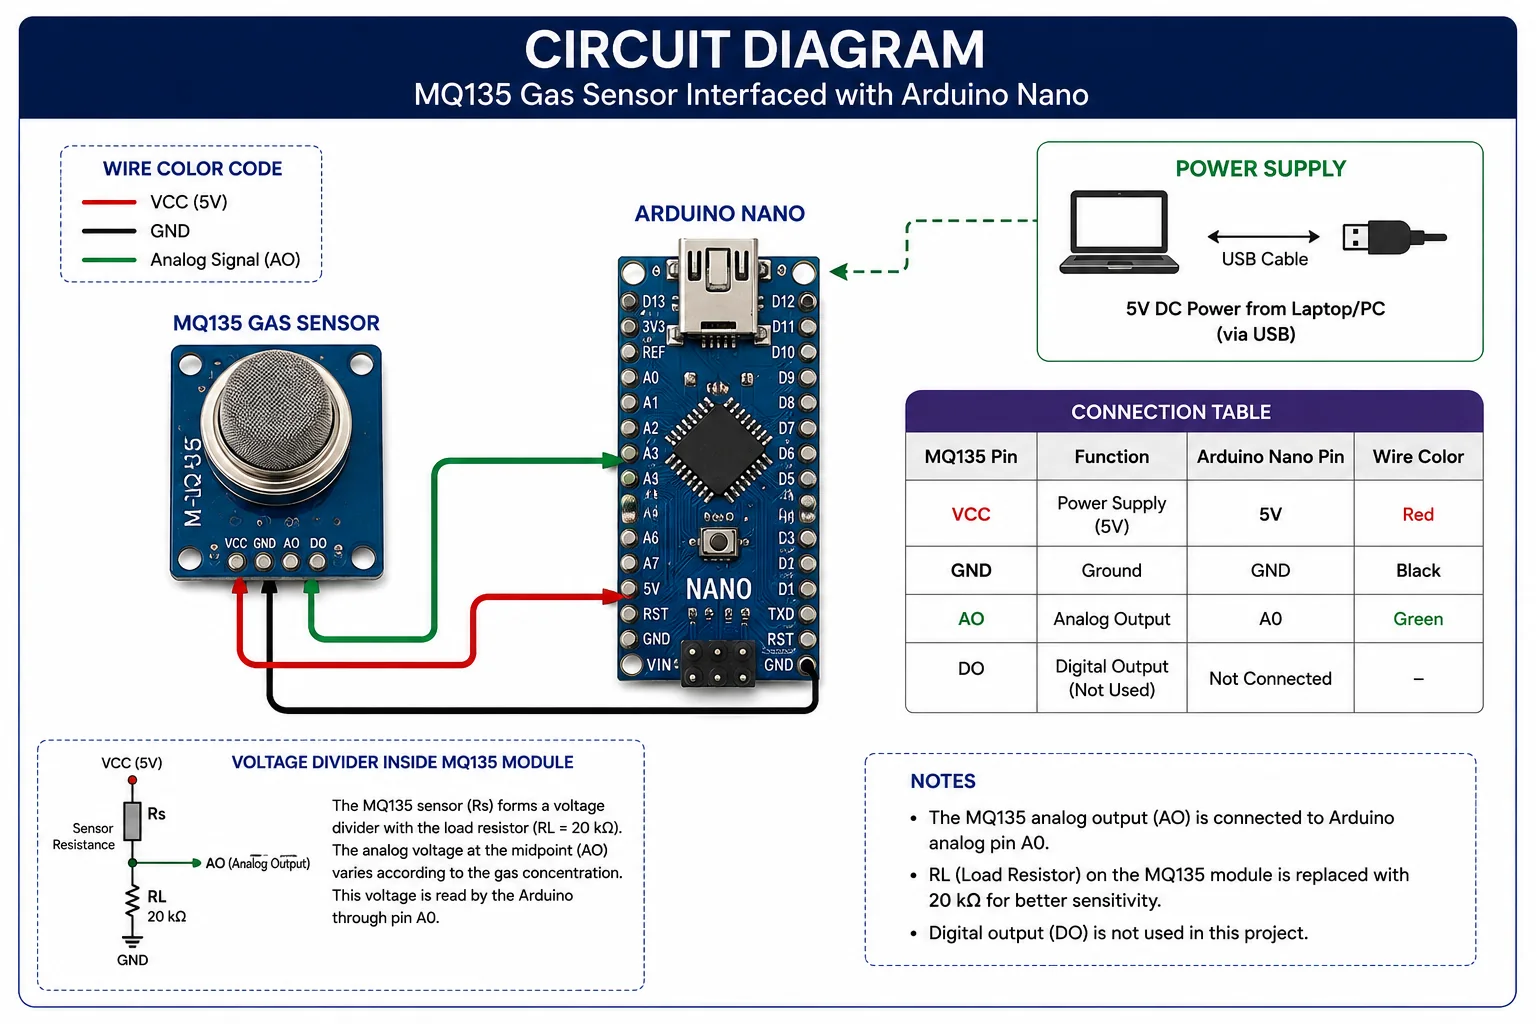
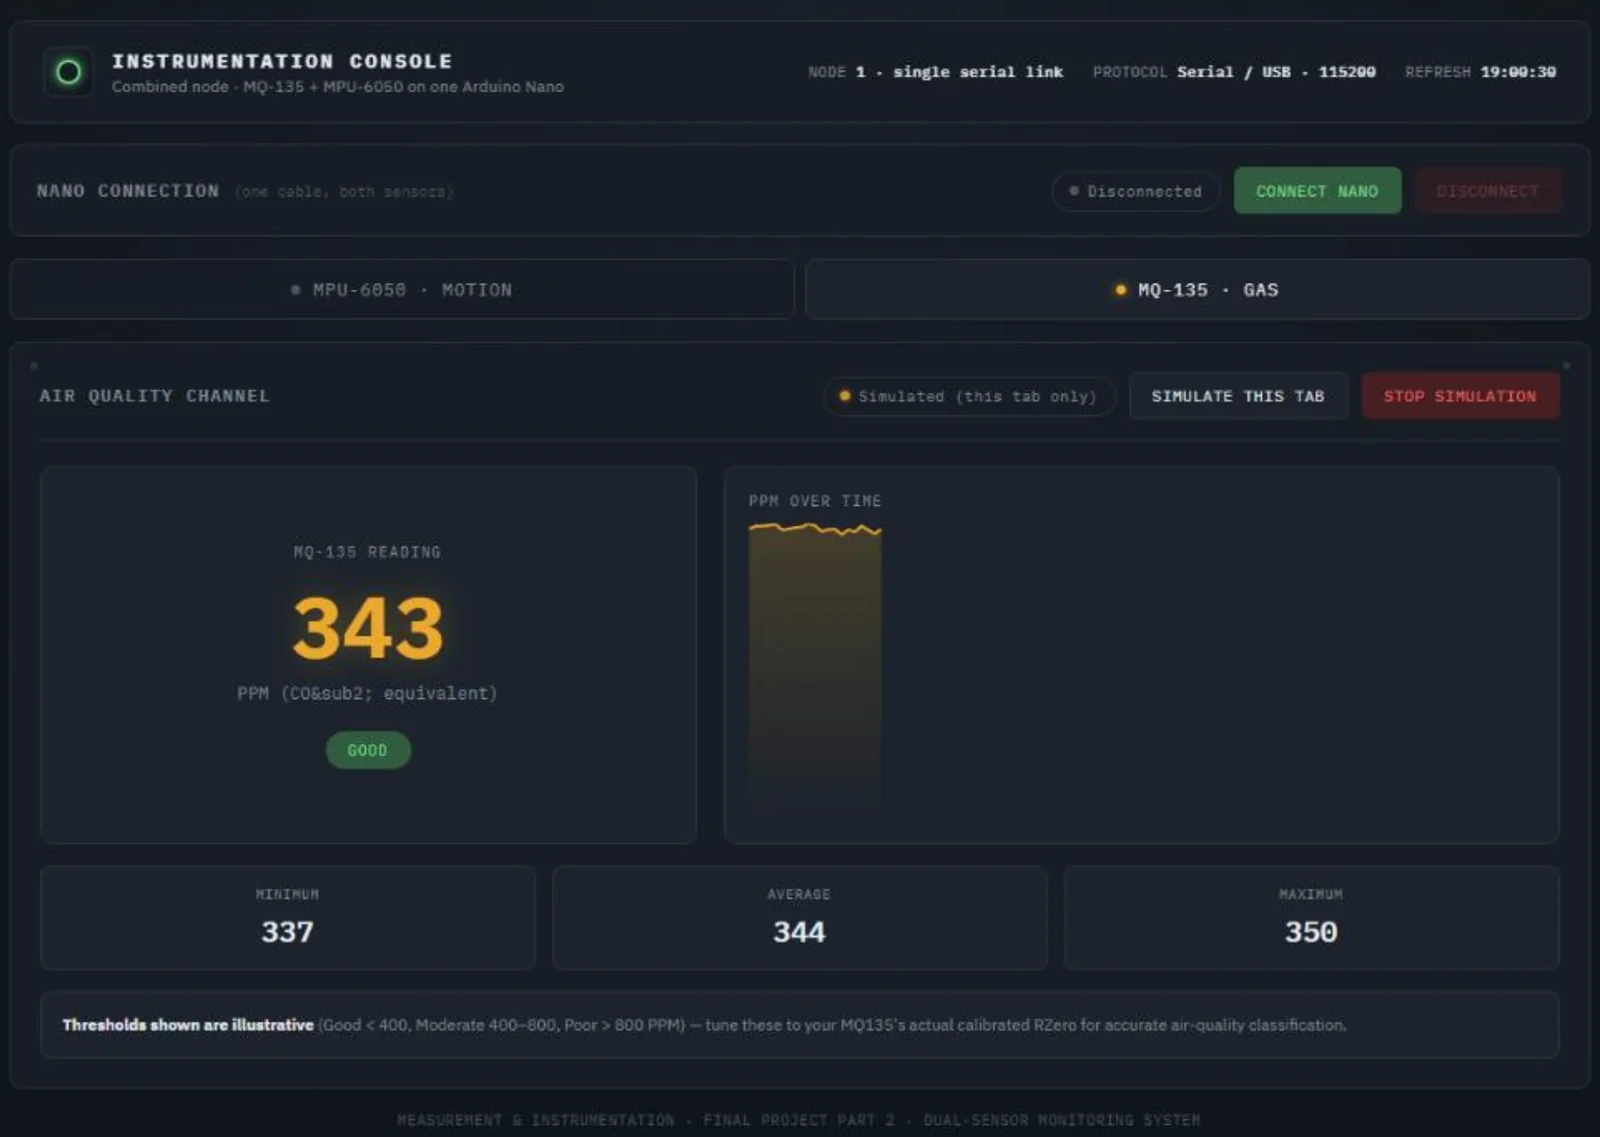
The MQ135 output is read on the Arduino Nano’s analog input. The sensor was preheated for 24 hours, used with a 20 kΩ load resistor, and its clean-air resistance R₀ was measured and averaged (221.3 for CO₂, 144.46 for ethanol) before measurements. A Python application replaced the serial monitor with live values and graphs.
CO₂ survey
Readings were taken at 15 locations with different ventilation and occupancy. Well-ventilated outdoor spots read close to normal atmospheric levels (about 376 ppm); a mechanical lab with several people and limited ventilation read about 2,172 ppm.
Ethanol response and an honest limit
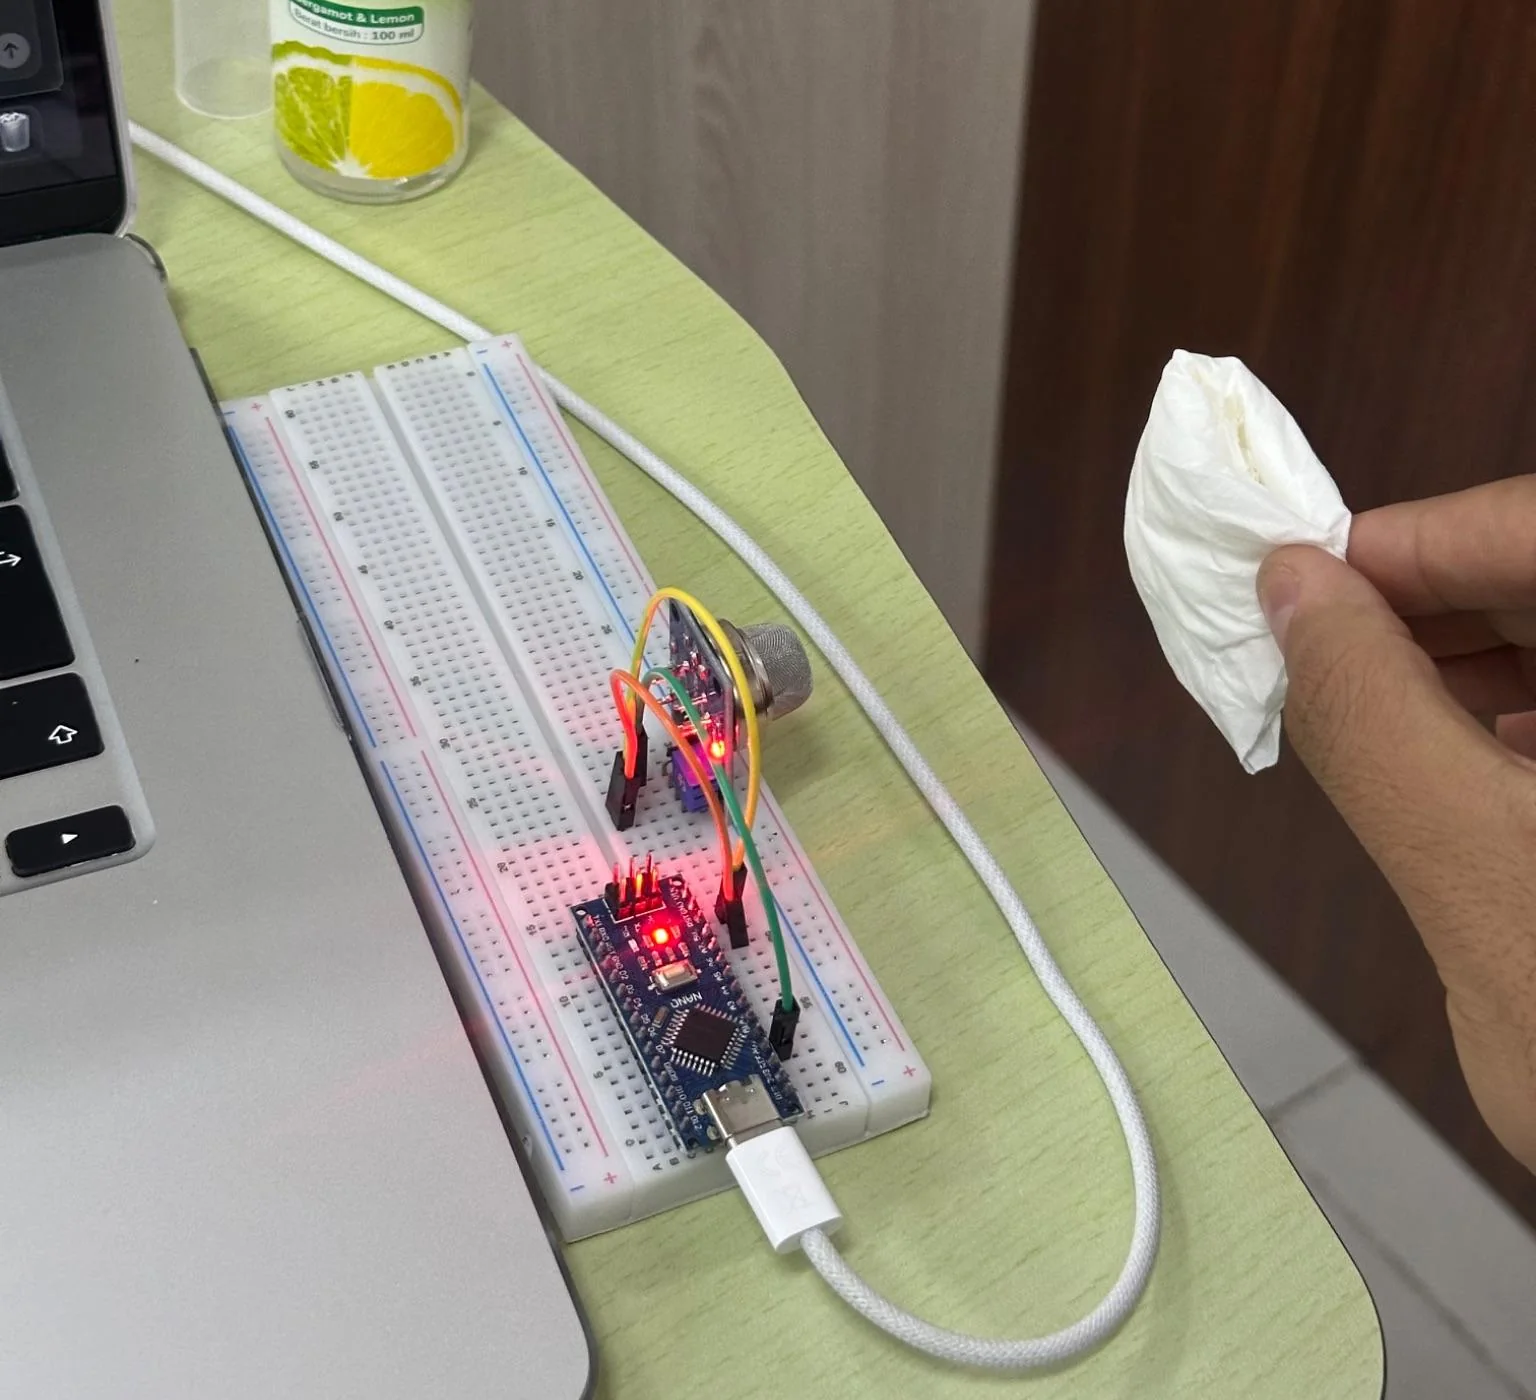
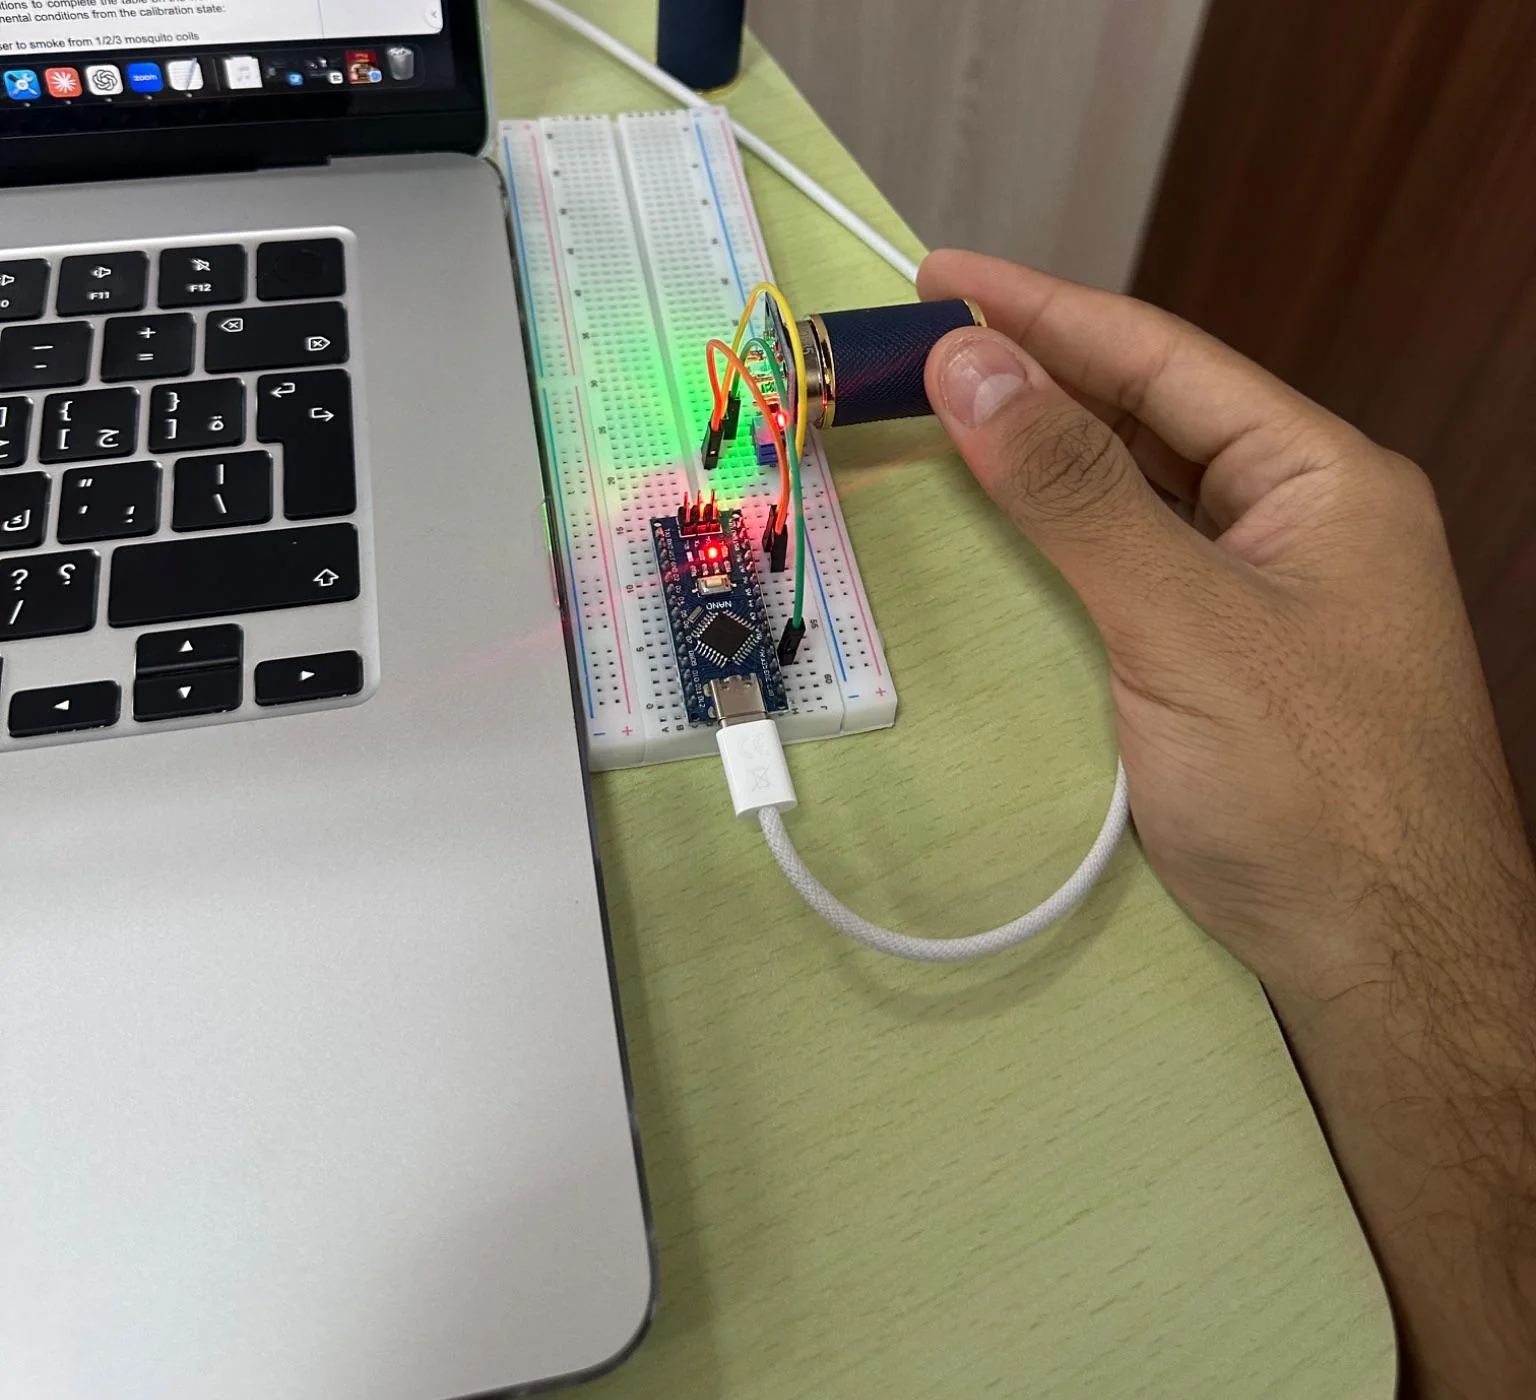
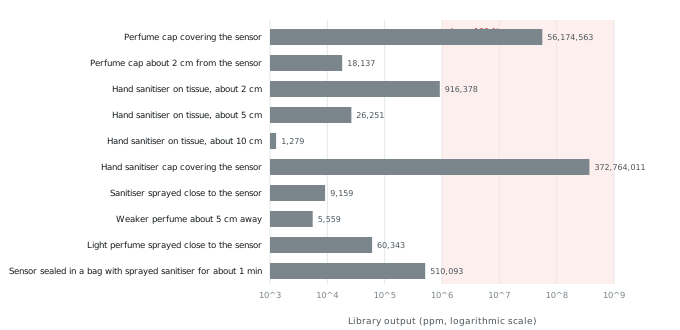
Exposed to hand sanitiser and perfume, the sensor responded immediately and recovered when the source was removed. Two readings exceeded 1,000,000 ppm, which is physically impossible, because the sensor’s conversion curve was being used far outside its specified range of roughly 10–1,000 ppm. The ethanol results are therefore treated as a relative indicator of exposure, not as concentrations.
What I would do differently
Shown
- Clear link between ventilation, occupancy and CO₂
Limits and next steps
- Compare against a reference CO₂ instrument
- Add temperature and humidity compensation
- Stay within the sensor's valid concentration range
Resources
- PDF Project report · 10 pagesAAQ-P01_MQ135-Gas-Measurement_Project-Report.pdf Open PDF