Speed Estimation Using the MPU6050 Accelerometer and Gyroscope
Two ways to estimate speed from a low-cost motion sensor, tested against measured distance and time, and an explanation of why one is seven times more accurate.
15 trials per method against a reference speed from measured distance and stopwatch time.
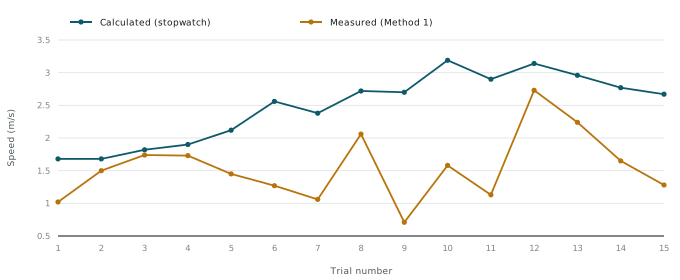
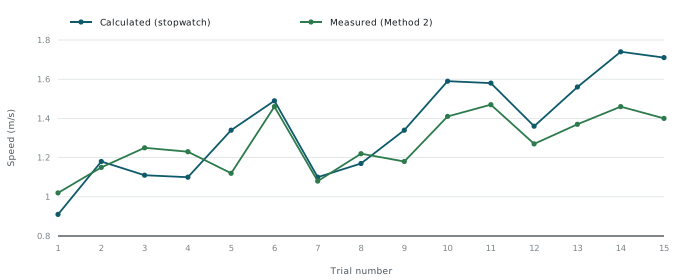
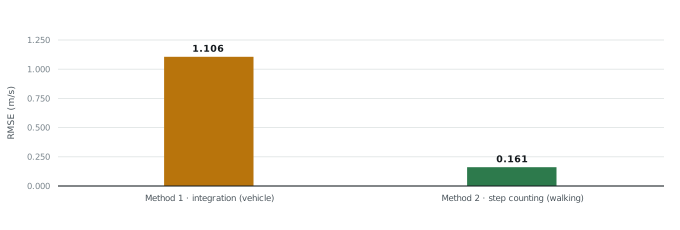
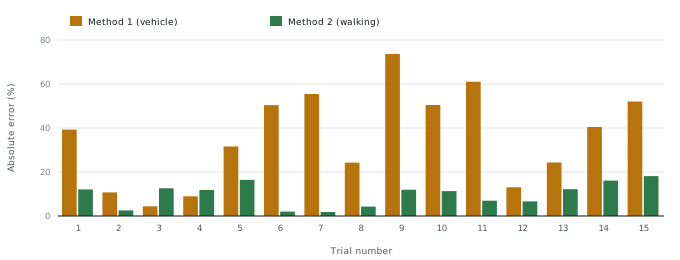
Step counting: RMSE 0.161 m/s (mean error 9.8%). Acceleration integration: RMSE 1.106 m/s (mean error 36.0%).
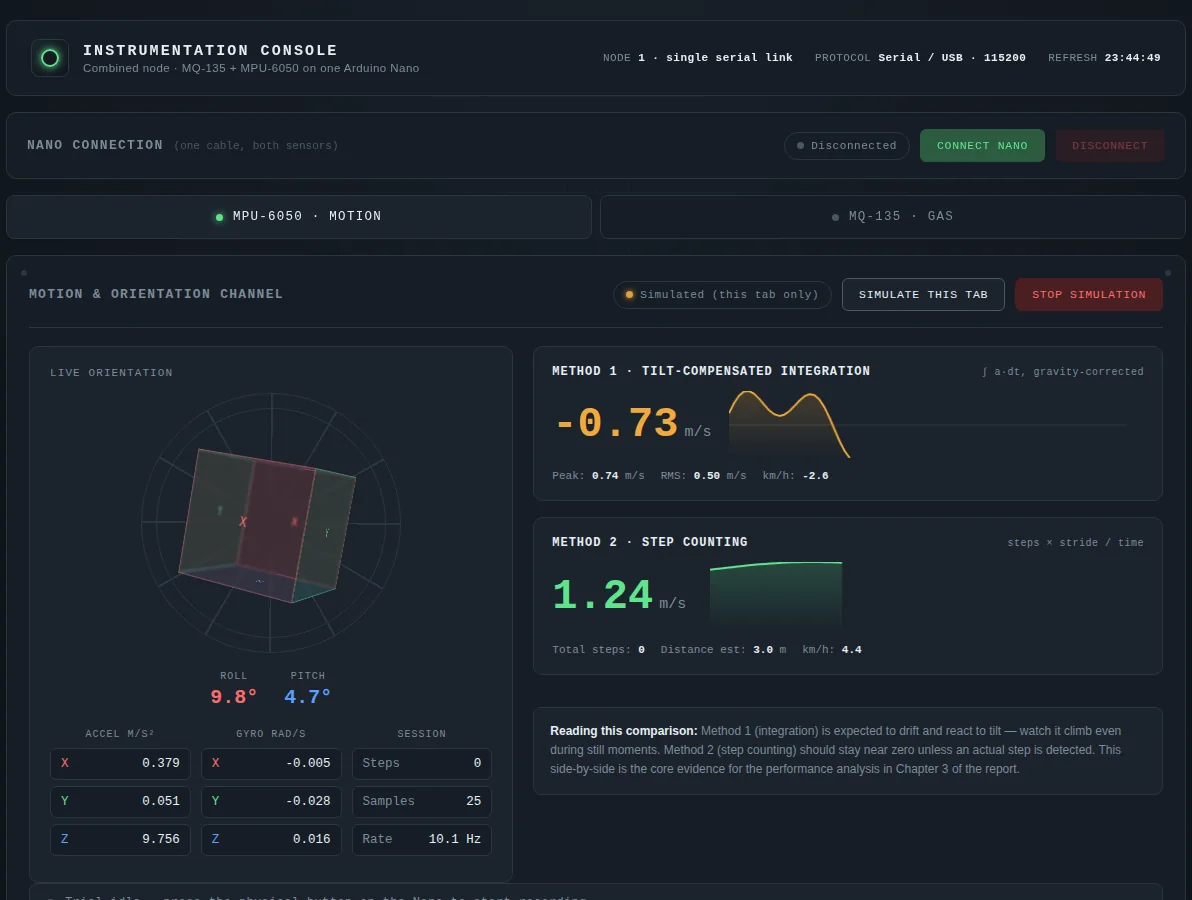
The PC dashboard was generated with AI assistance, as the course allowed; the prompt is disclosed in the report.
Question
Can a low-cost accelerometer and gyroscope measure speed well enough to be useful, and which method should be used? Integrating acceleration is the obvious approach; counting steps is a simpler alternative for walking.
Set-up and signal processing
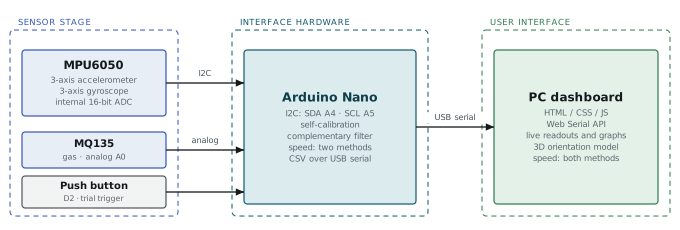
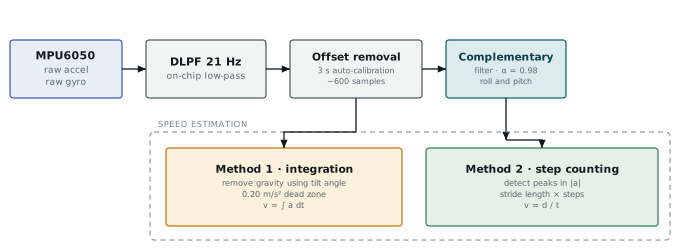
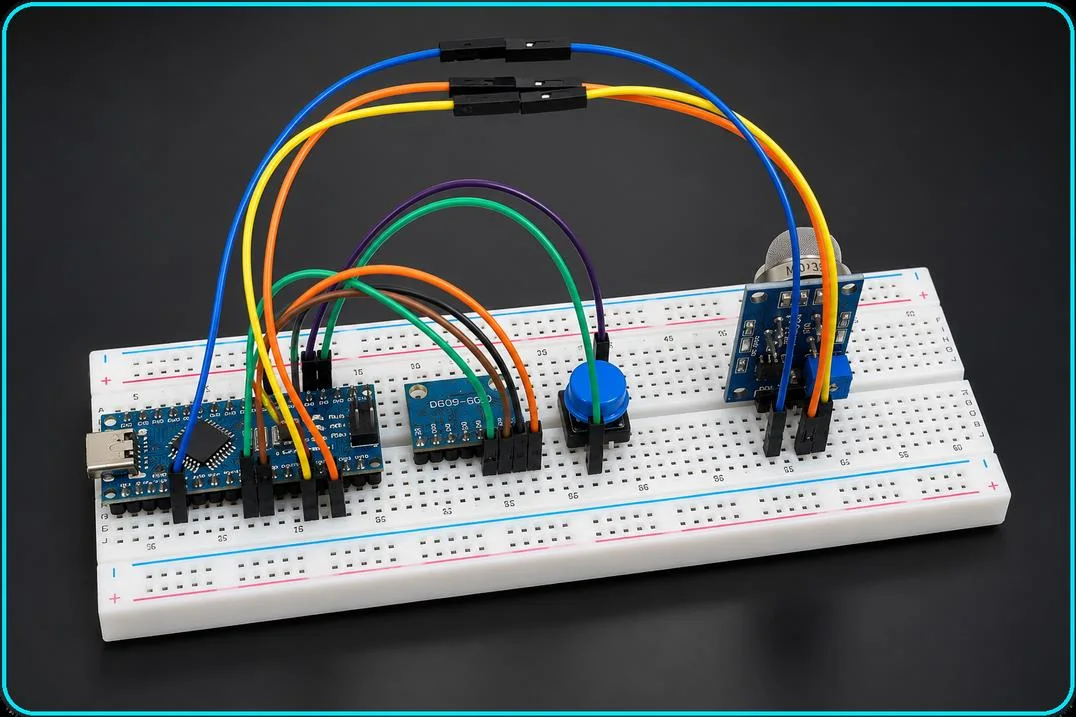
The MPU6050 connects over I2C to an Arduino Nano, which streams data to a web dashboard over Web Serial. The sensor’s internal low-pass filter is set to 21 Hz; a complementary filter (α = 0.98) estimates roll and pitch to remove gravity from the acceleration axes; and a 0.20 m/s² dead zone suppresses residual noise. On every start-up the system averages about 600 samples over 3 seconds to self-calibrate all six axes.
Experiments
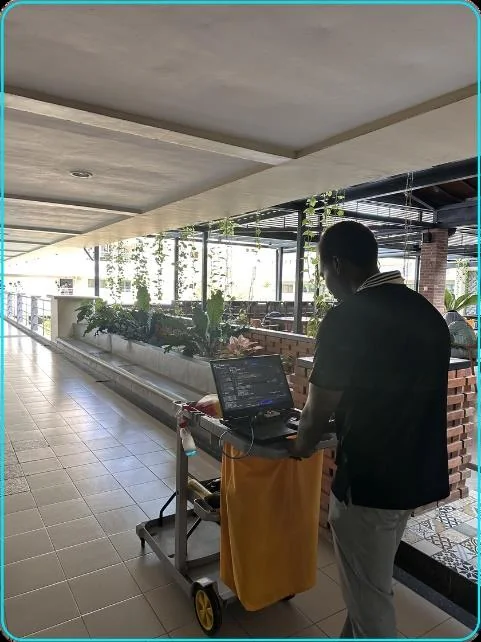
Method 1 (integration) was tested with the sensor mounted on a campus cleaning cart over 5–20 m runs. Method 2 (step counting × stride length ÷ time) was tested by walking a corridor over the same distances.

Results
Step counting was about seven times more accurate. Integration turns any small leftover bias into a velocity error that grows with time, and vehicle vibration and tilt add to it. Counting discrete footsteps does not accumulate error over time; its limit is how consistent the stride length is.
Limits and next steps
Shown
- Clear, physically explained difference between methods
- Integration alone is not reliable for vehicle speed
Limits and next steps
- Fixed stride length; reference timing by hand stopwatch
- Next: sensor fusion, a magnetometer for heading, cadence-based stride length
Resources
- PDF Project report · 12 pagesAAQ-P03_MPU6050-Speed-Estimation_Project-Report.pdf Open PDF